
Recently I was reminded of some work we did a number of years ago. It involved a large research database, painstakingly collected over 20 years. The data was defined across a number of specialisations within a single clinical domain and represented in 83 data dictionaries stored in an Excel spreadsheet.
Data was collected based on a series of questionnaires, and we were told that successive data custodians had, true to human nature, made slight tweaks and updates to the questionnaires on multiple occasions. The data collected was actually evolving!
The only way to view the data was to open each of the 83 spreadsheets, painstakingly, one by one.
We were engaged to create archetypes to represent both the legacy data and the data that the research organisation wished to standardise to take forward.
So the activity of converting these data dictionaries - firstly to archetypes for each clinical concept, and then representing each data dictionary as a template - resulting in considerable insight into the quality and scope of the data that hadn't been available previously.
For example, the mind map below is an aggregation of the various ways that questions were asked about the topic of smoking.
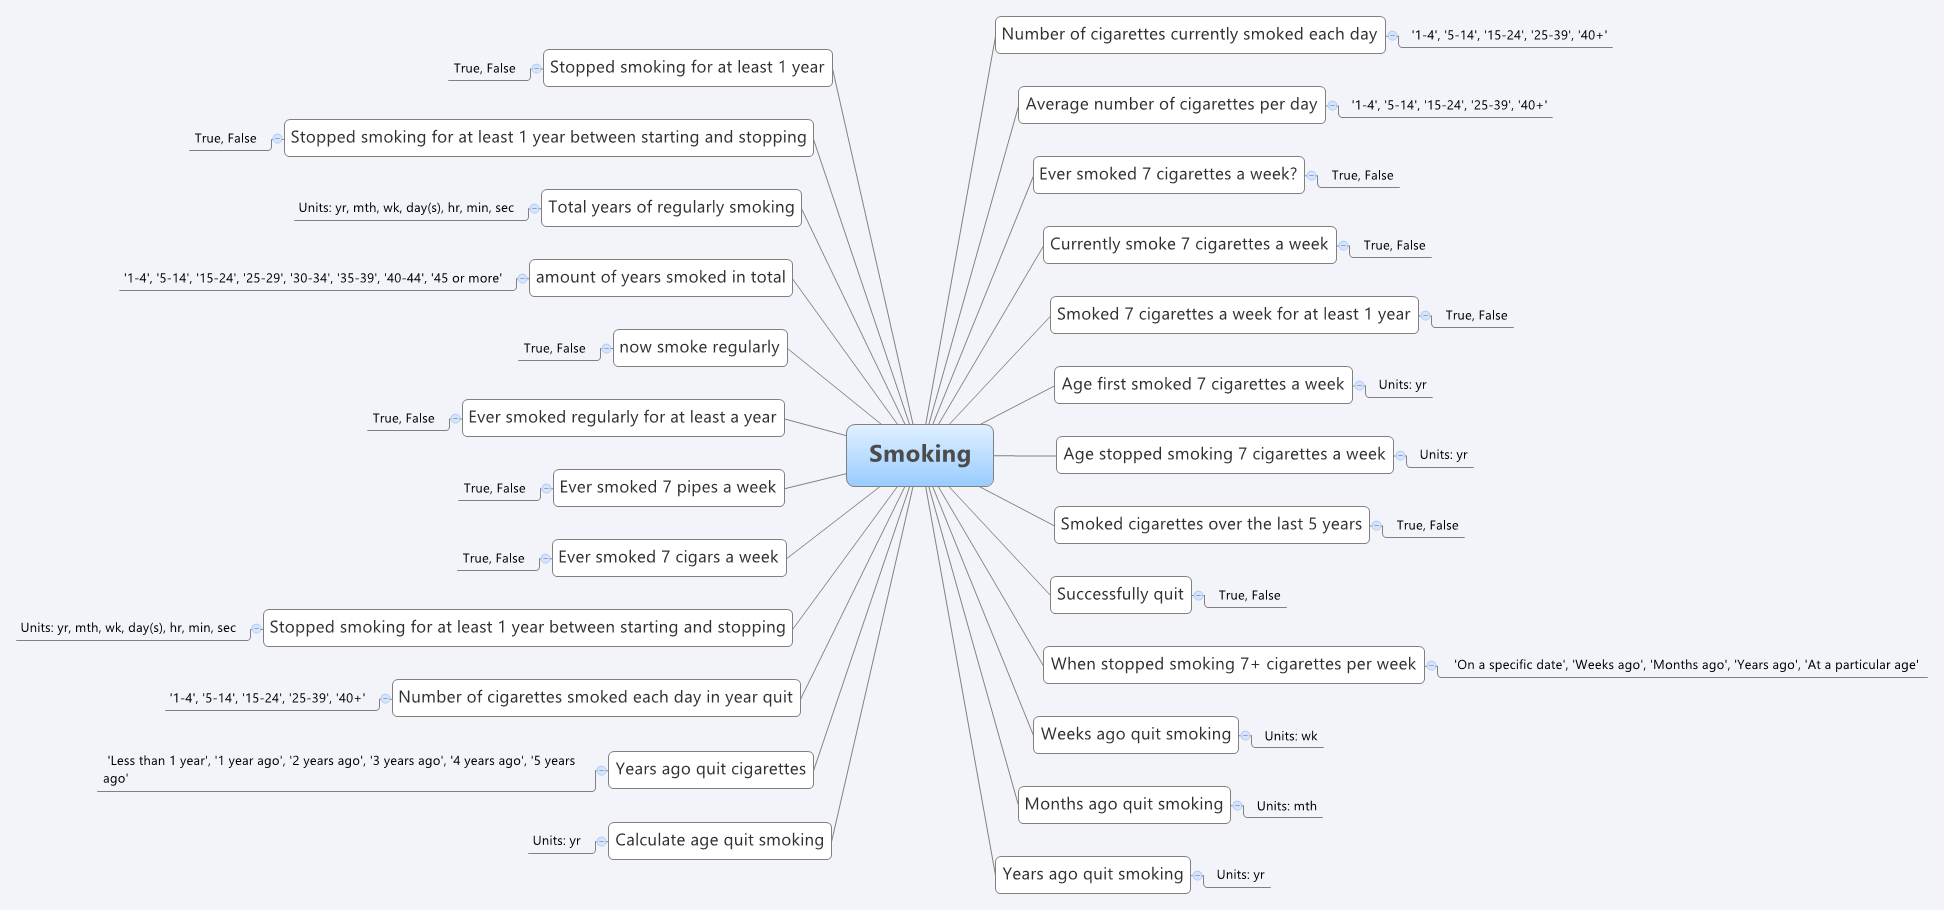 Interestingly, what it showed was that no one individual in the organisation had full oversight of the detailed data in all of the data dictionaries.The development of the archetypes effectively provided a cross section of the data focusing on commonality at a clinical concept level and revealed insights into the whole data collection that was a major surprise to the research organisation. It triggered an internal review and major revision of their data.
Some of the issues apparent in this mind map are:
- A number of questions have been asked in slightly different ways, but with slight semantic variation, thus creating the old 'apples' vs 'pears' problem when all we wanted was a basket of apples;
- Often the data is abstracted and recorded in categories, rather than recording the actual, valuable raw data which could be used for multiple purposes, not just he purpose of the rigid categories;
- Some questions have 'munged' two questions together with a single True/False answer, resulting in somewhat ambiguous data; and
- Some questions are based on fixed intervals of time.
No doubt you will see other issues or have more variations of your own you could share in your systems.
And we have repeatedly seen a number of our clients undergo this same process, where archetypes help to reveal issues with enormously valuable data that had previously been obscured by spreadsheets and the like. The creation of archetypes and re-use of archetypes as consistent patterns for clinical content has an enormous positive impact on the quality of data that is subsequently collected.
And while harmonisation and pattern re-use within one organisation or project can be hard enough, standardisation between organisations or regions or national programs or even internationally has further challenges. It may take a while to achieve broader harmonisation but the benefits of interoperability will be palpable when we get there.
In the meantime the archetypes are a great way to trigger the necessary conversations between the clinicians, domain experts, organisations, vendors and other interested parties - getting a handle on our data is a human issue that needs dialogue and collaboration to solve.
Archetypes are a great way to get a handle on our data.